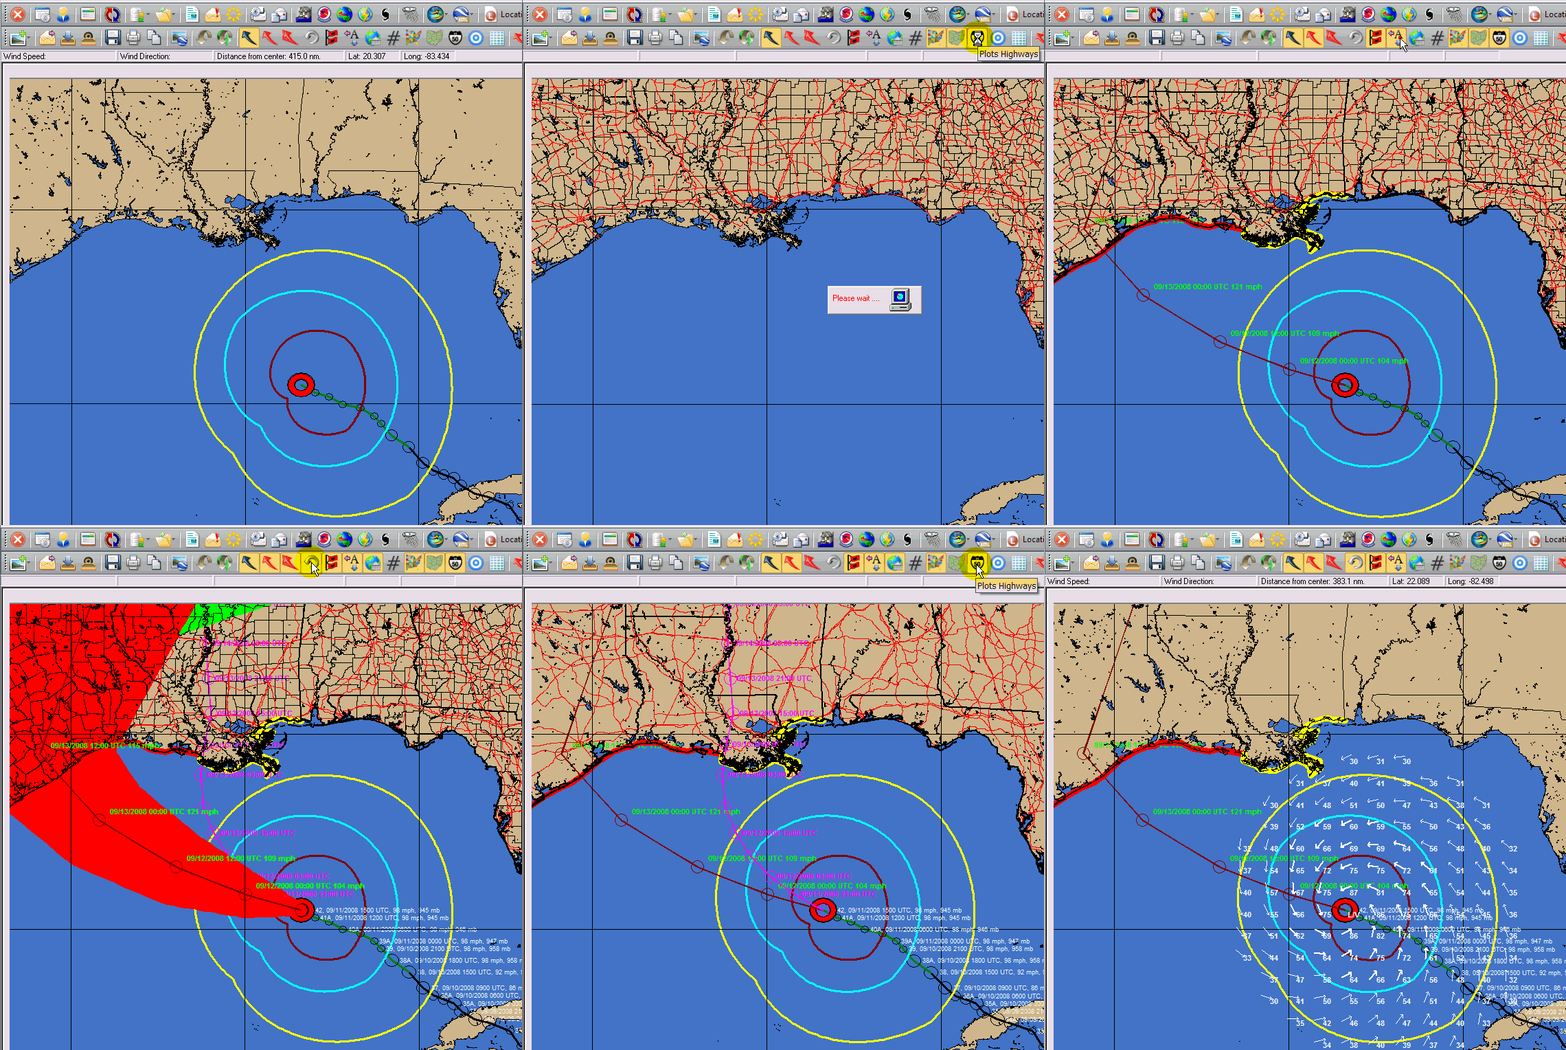
For 2011 we’re launching a tool that gives users the option to selectively turn on and turn off data layers during a tracking exercise. For example, rather than plotting a storm or geographic feature and then having to “undo” it at a later time... the user may now simply select/turn on an icon to show the information on a tracking map and select the icon again (turn off) to remove it from the tracking map. This real time enhancement makes creating a tracking map display extremely quick and easy.
Watch the short video or animated GIF below for more information
Click here if viewing with IPad
