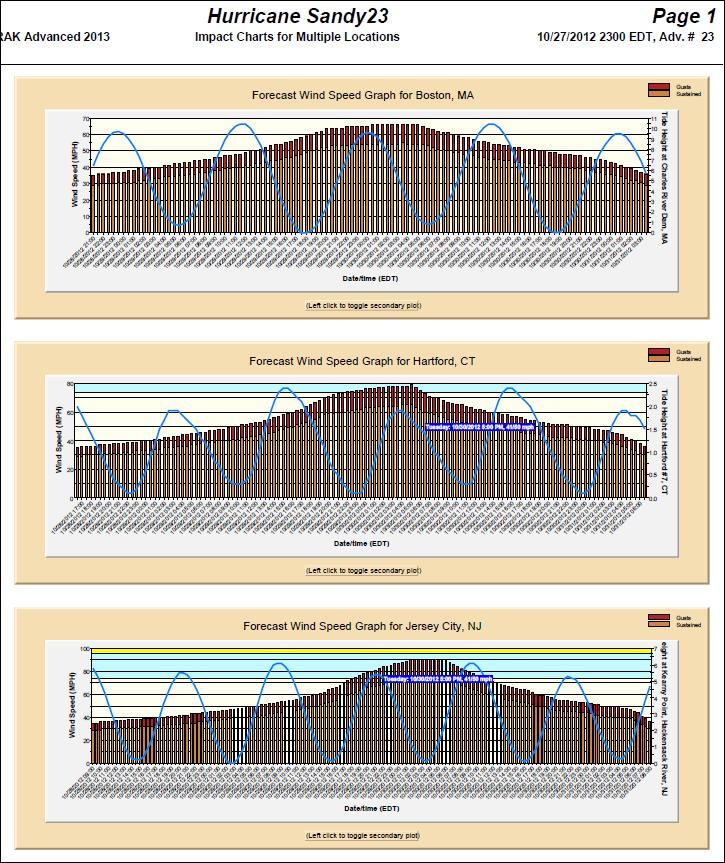
Tab, Automatic and manual Risk Impact
Reports now include tidal data in both report and graphical (tide
harmonics) form. There is also a new “graph only” risk impact report
Tab Risk Impact Sample (click on image for larger view)
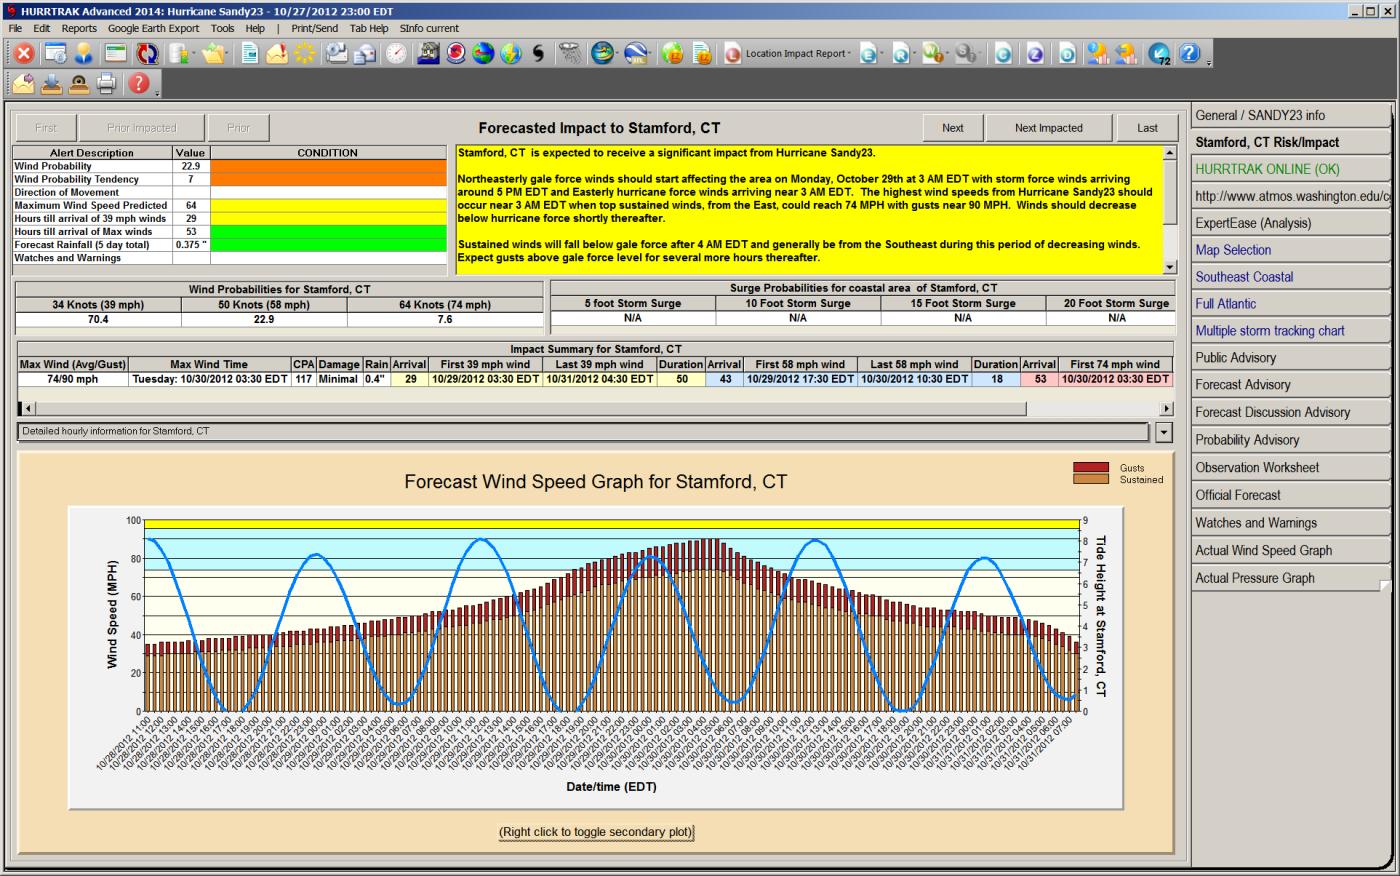
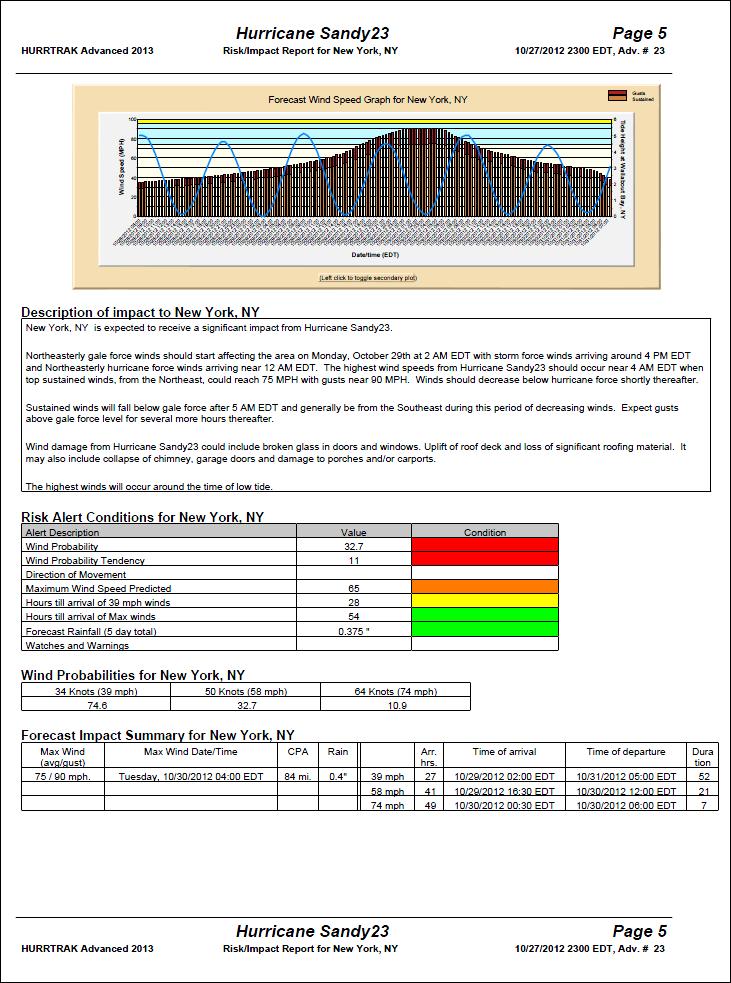
Risk Impact Report Sample Page
Sample Full Report (Standard Risk Impact)
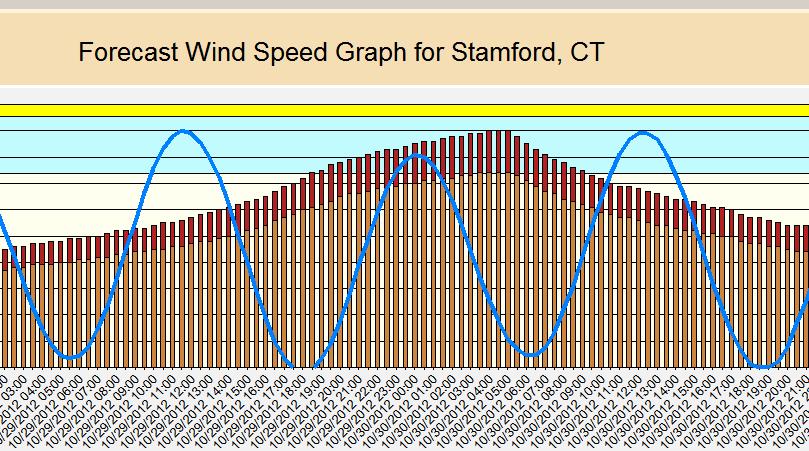
Sample page of graph only report
Sample Full Report (Graph only Risk Impact)