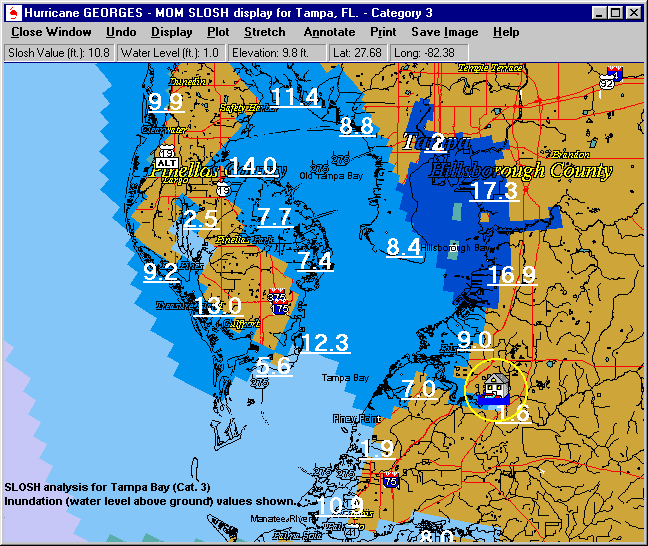
SLOSH Inundation analysis
In addition to displaying the raw slosh data, which displays the potential surge flood level above sea level (asl), the system can also estimate inundation levels. I.E., the water level above ground (AGL). To determine this the system uses the slosh values as well as USGS 2 arc-second elevation model data. See SLOSH ANALYSIS for more information on that topic.
Below is an example of a SLOSH MOM plot for a Cat. 3 storm along with the inundation values shown. The system can also display "friendly" icons (see yellow circle), giving a visual indication of the water level at the cursor location.

![]()
Copyright ©2004 PC Weather Products, Inc., All
Rights Reserved.